Choksi NMS - Network Monitoring System
Complete Unified Management Software for IT and OT Infrastructure. Monitor networks, servers, storage, cloud services, virtualization platforms, and more.
Complete Unified Management Software for IT and OT Infrastructure. Monitor networks, servers, storage, cloud services, virtualization platforms, and more.
The platform delivers key functionalities such as Quality of Service (QoS) tracking, rich reporting capabilities, customizable dashboards, SD-WAN health and performance analysis, and continuous link monitoring with robust SLA calculations.

A unified system for tracking the overall status and performance of network hardware, servers, applications, databases, and every IT endpoint.
The tool is vendor neutral and compatible with a wide range of devices from different manufacturers. This ensures organizations are not locked into specific hardware vendors.
Users can define custom retention periods for polled data. Configure short-term retention for high-frequency data while maintaining long-term historical data for trend analysis.
Capable of discovering and monitoring both IPv4 and IPv6 devices. The platform seamlessly handles dual-stack environments.
Supports a multi-tenant architecture with multi-browser compatibility, ensuring secure access for different user groups with role-based access control.
Generate dedicated views or dashboards for any device class, including Network devices, firewalls, servers, applications, IP Cameras, Wi-Fi gear, VSATs, and UPS units.
Includes Alarm Suppression, Anomaly Detection, and Business Service mapping. Machine learning algorithms identify patterns and predict potential failures.
From automated discovery to advanced fault management, Choksi NMS provides everything you need to monitor and manage your infrastructure effectively.
Automated and continuous discovery process that periodically scans network ranges. Supports SNMP, HTTP, Ping, SSH, and more with automatic topology mapping using CDP, LLDP, and FDP.
Enterprise-grade security with AES 256 encryption, integration with RADIUS, TACACS, Active Directory, and LDAP. Role-based access control with comprehensive audit trails.
Granular polling intervals, traffic analysis, SD-WAN monitoring with latency and jitter tracking. Monitors CPU, memory, disk utilization, and response times across all devices.
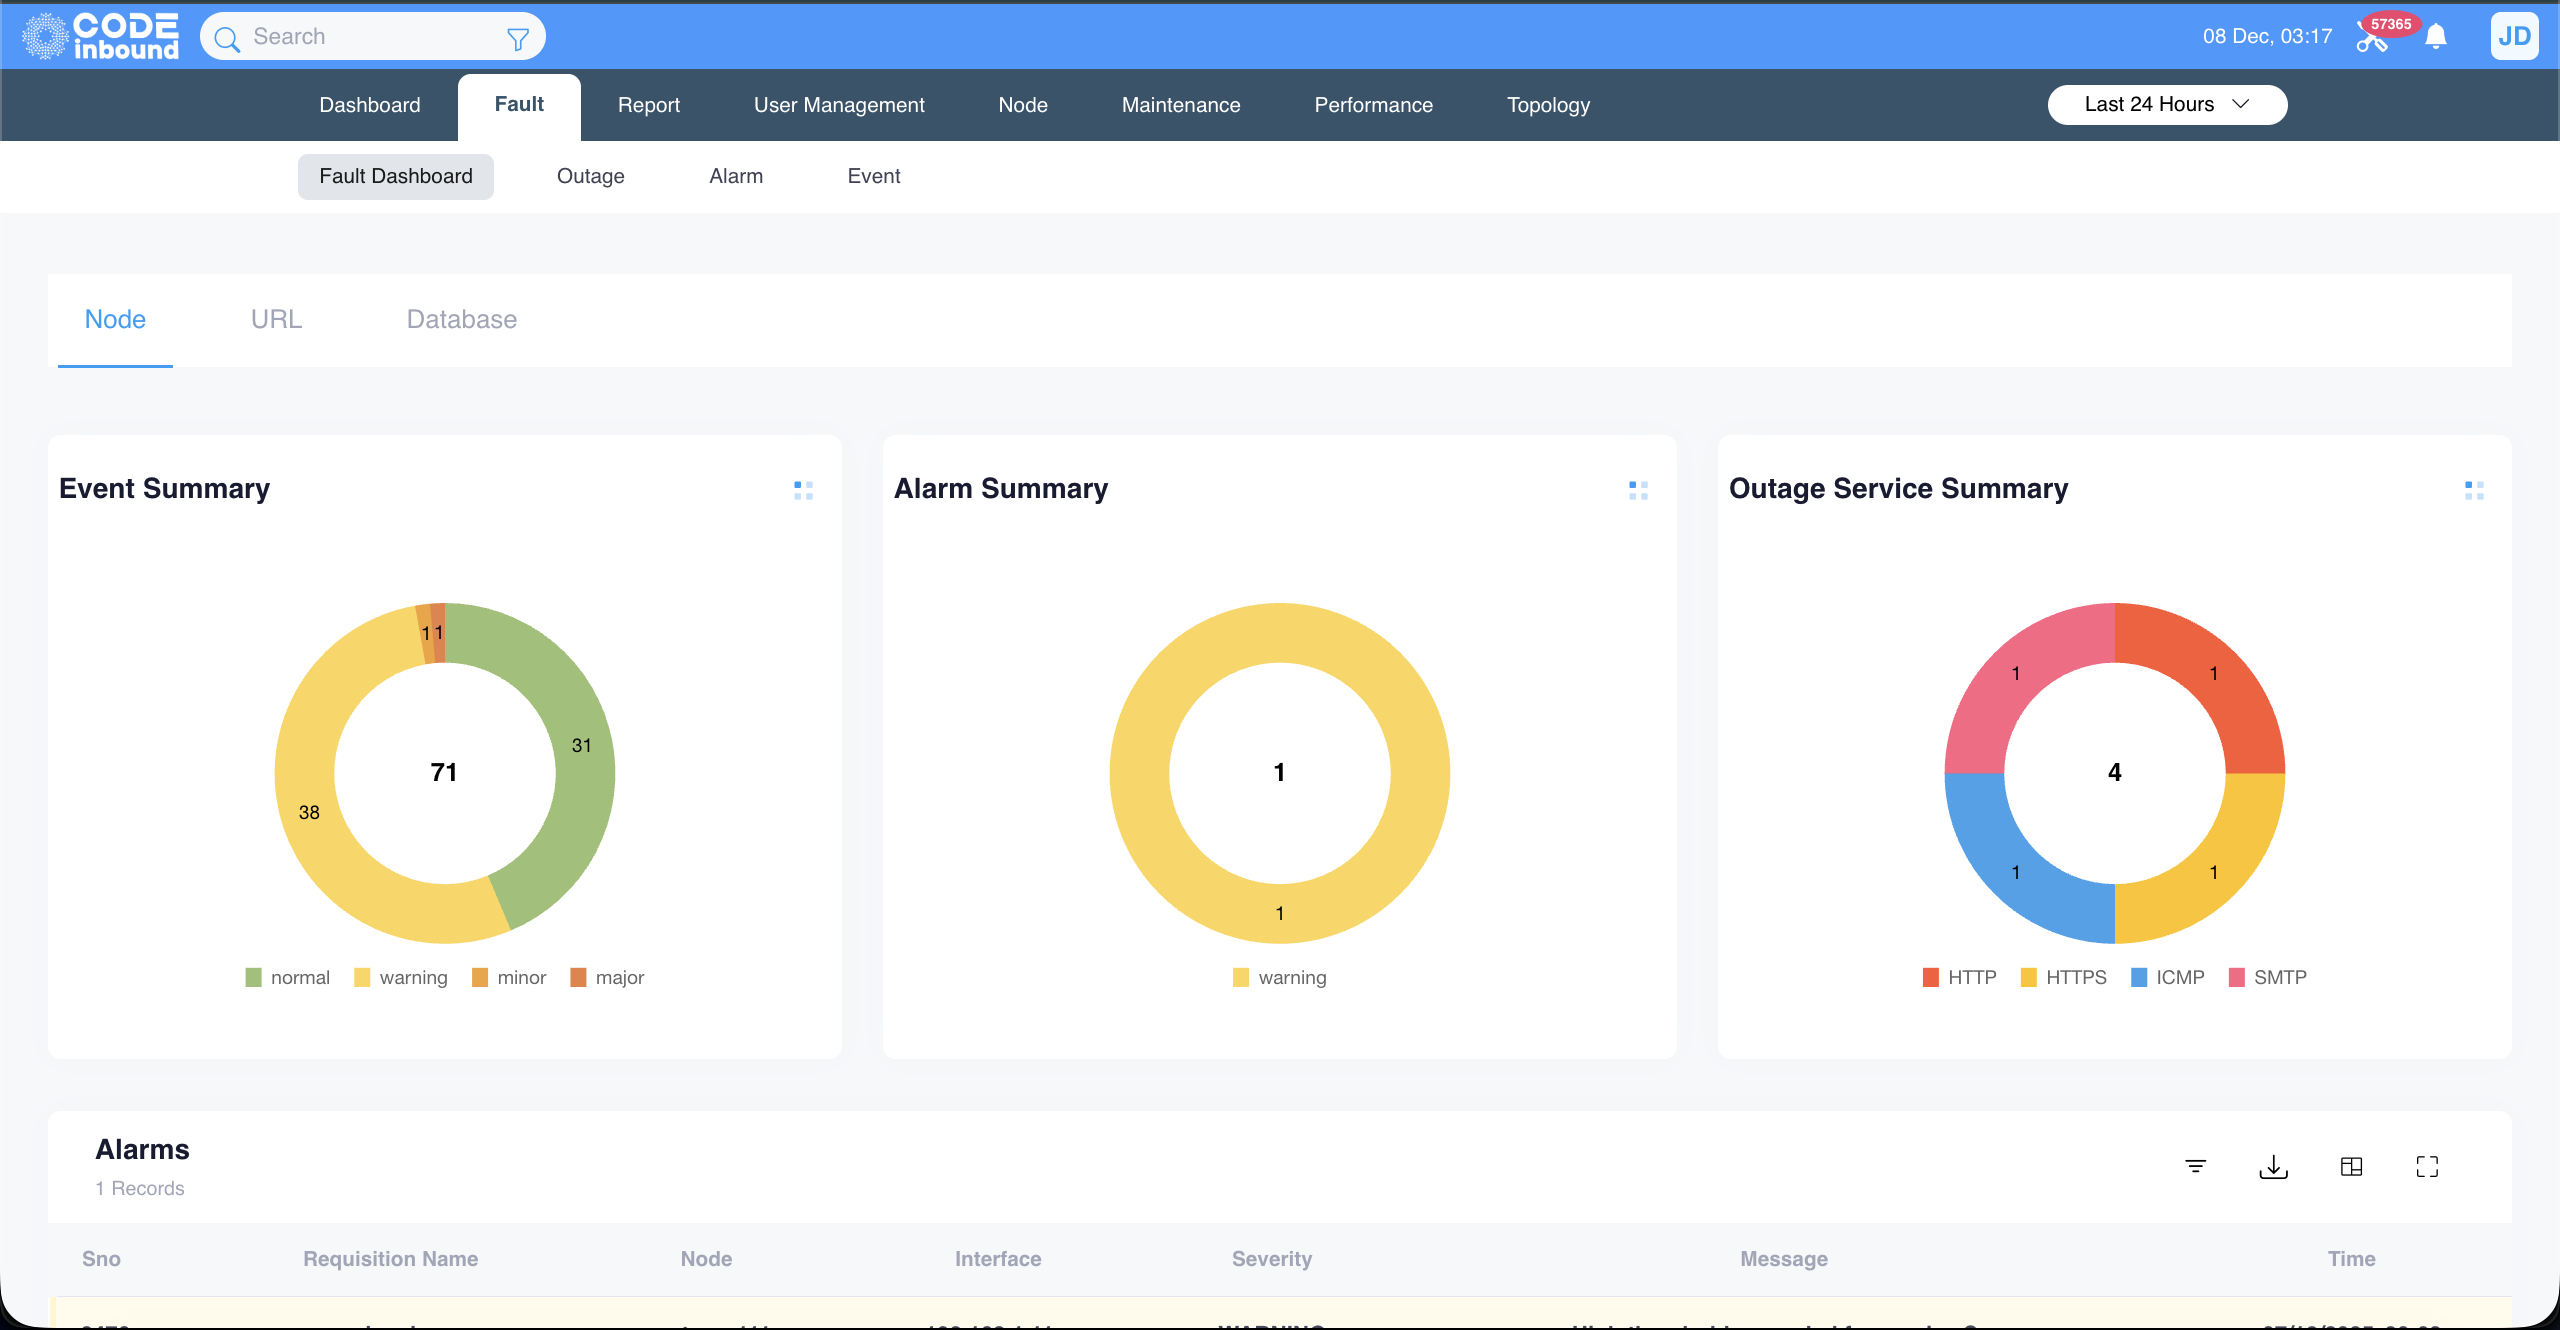
Intelligent event handling with filtering, de-duplication, and correlation. Multi-level severity definitions with automated response and alerts via email, SMS, and SNMP traps.
Link grouping for ISP redundancy, service-level SLA calculations, and automatic downtime exclusion during maintenance windows with comprehensive SLA reporting.
Monitor VMs, Hypervisors, and Clusters from VMWare, Citrix, Nutanix. Application monitoring for web servers, databases, and critical business services.
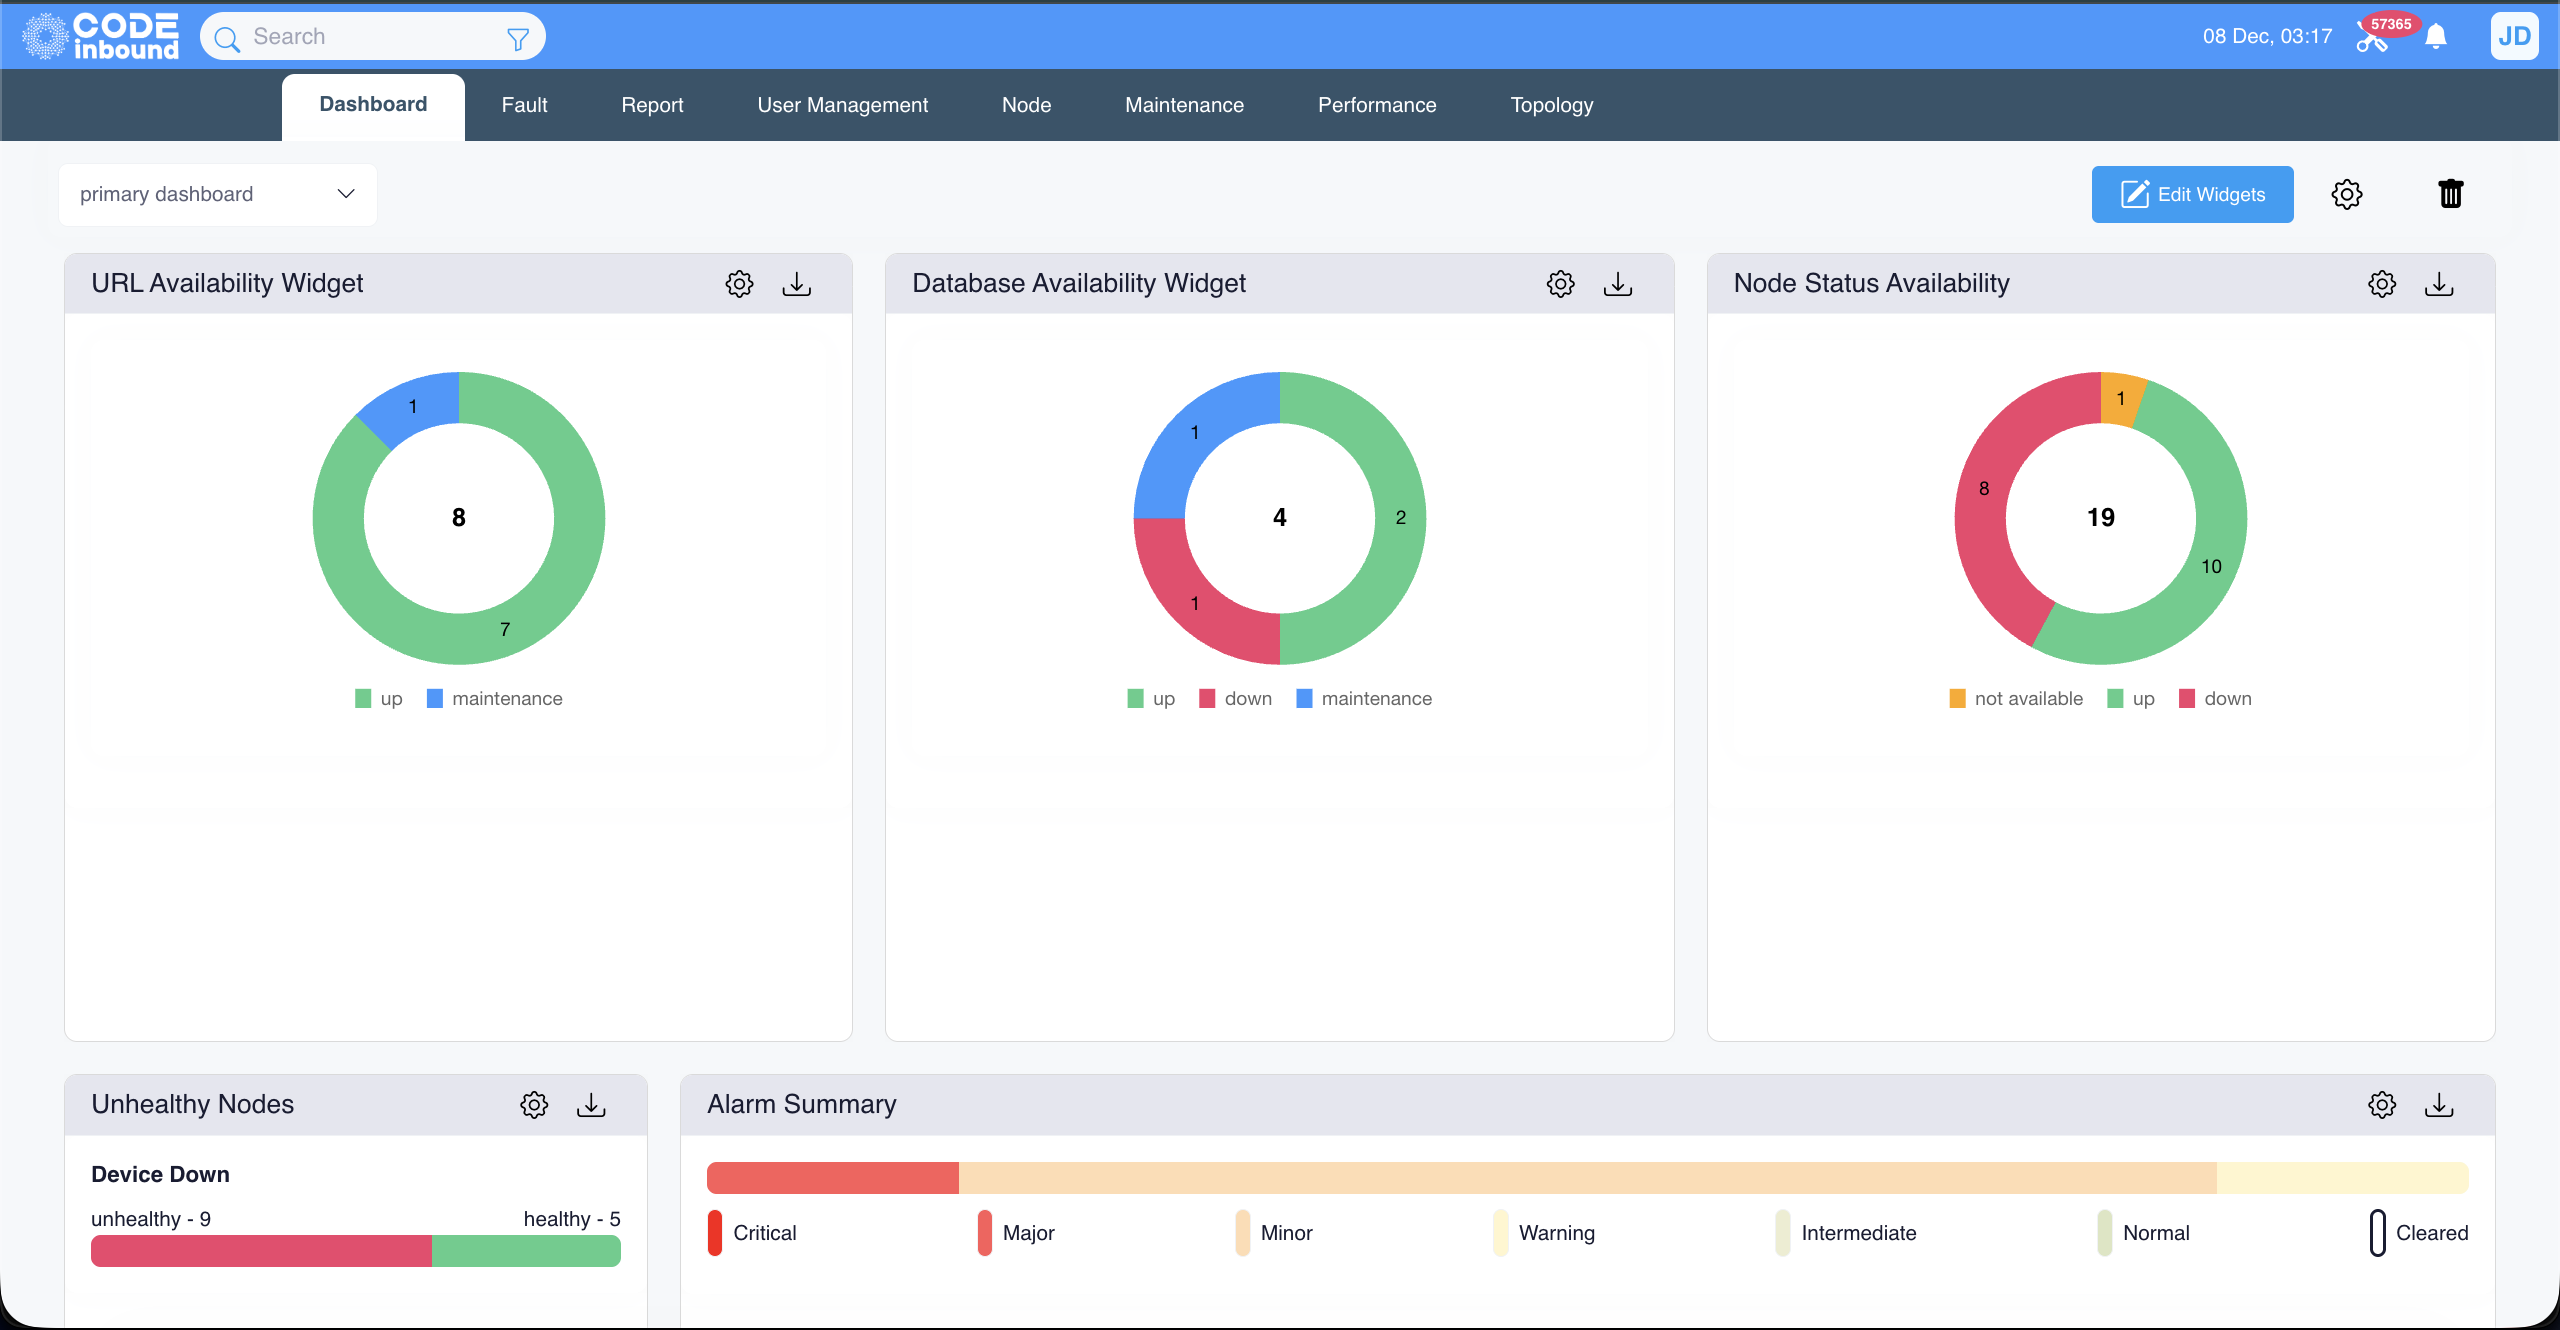
From topology maps to performance graphs, get complete visibility into your infrastructure health and performance.
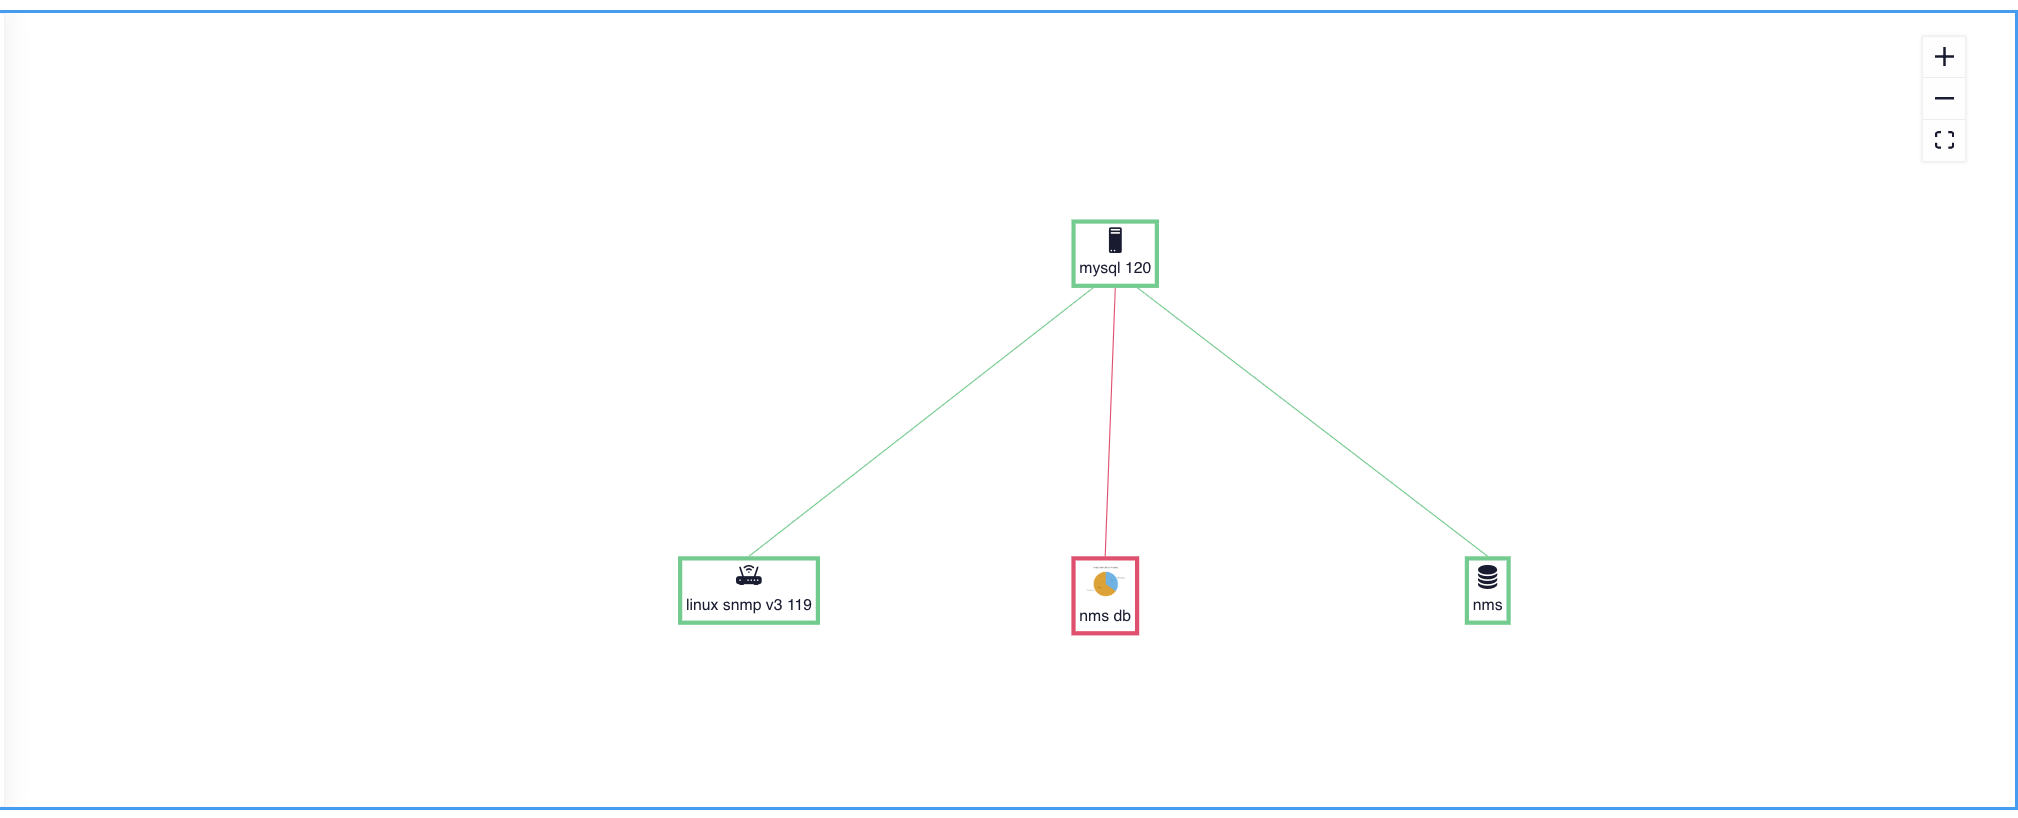
Automatic topology mapping with physical connections, geo-location maps, and Layer 2/Layer 3 views. Interactive drill-down from high-level overviews to detailed device interfaces.
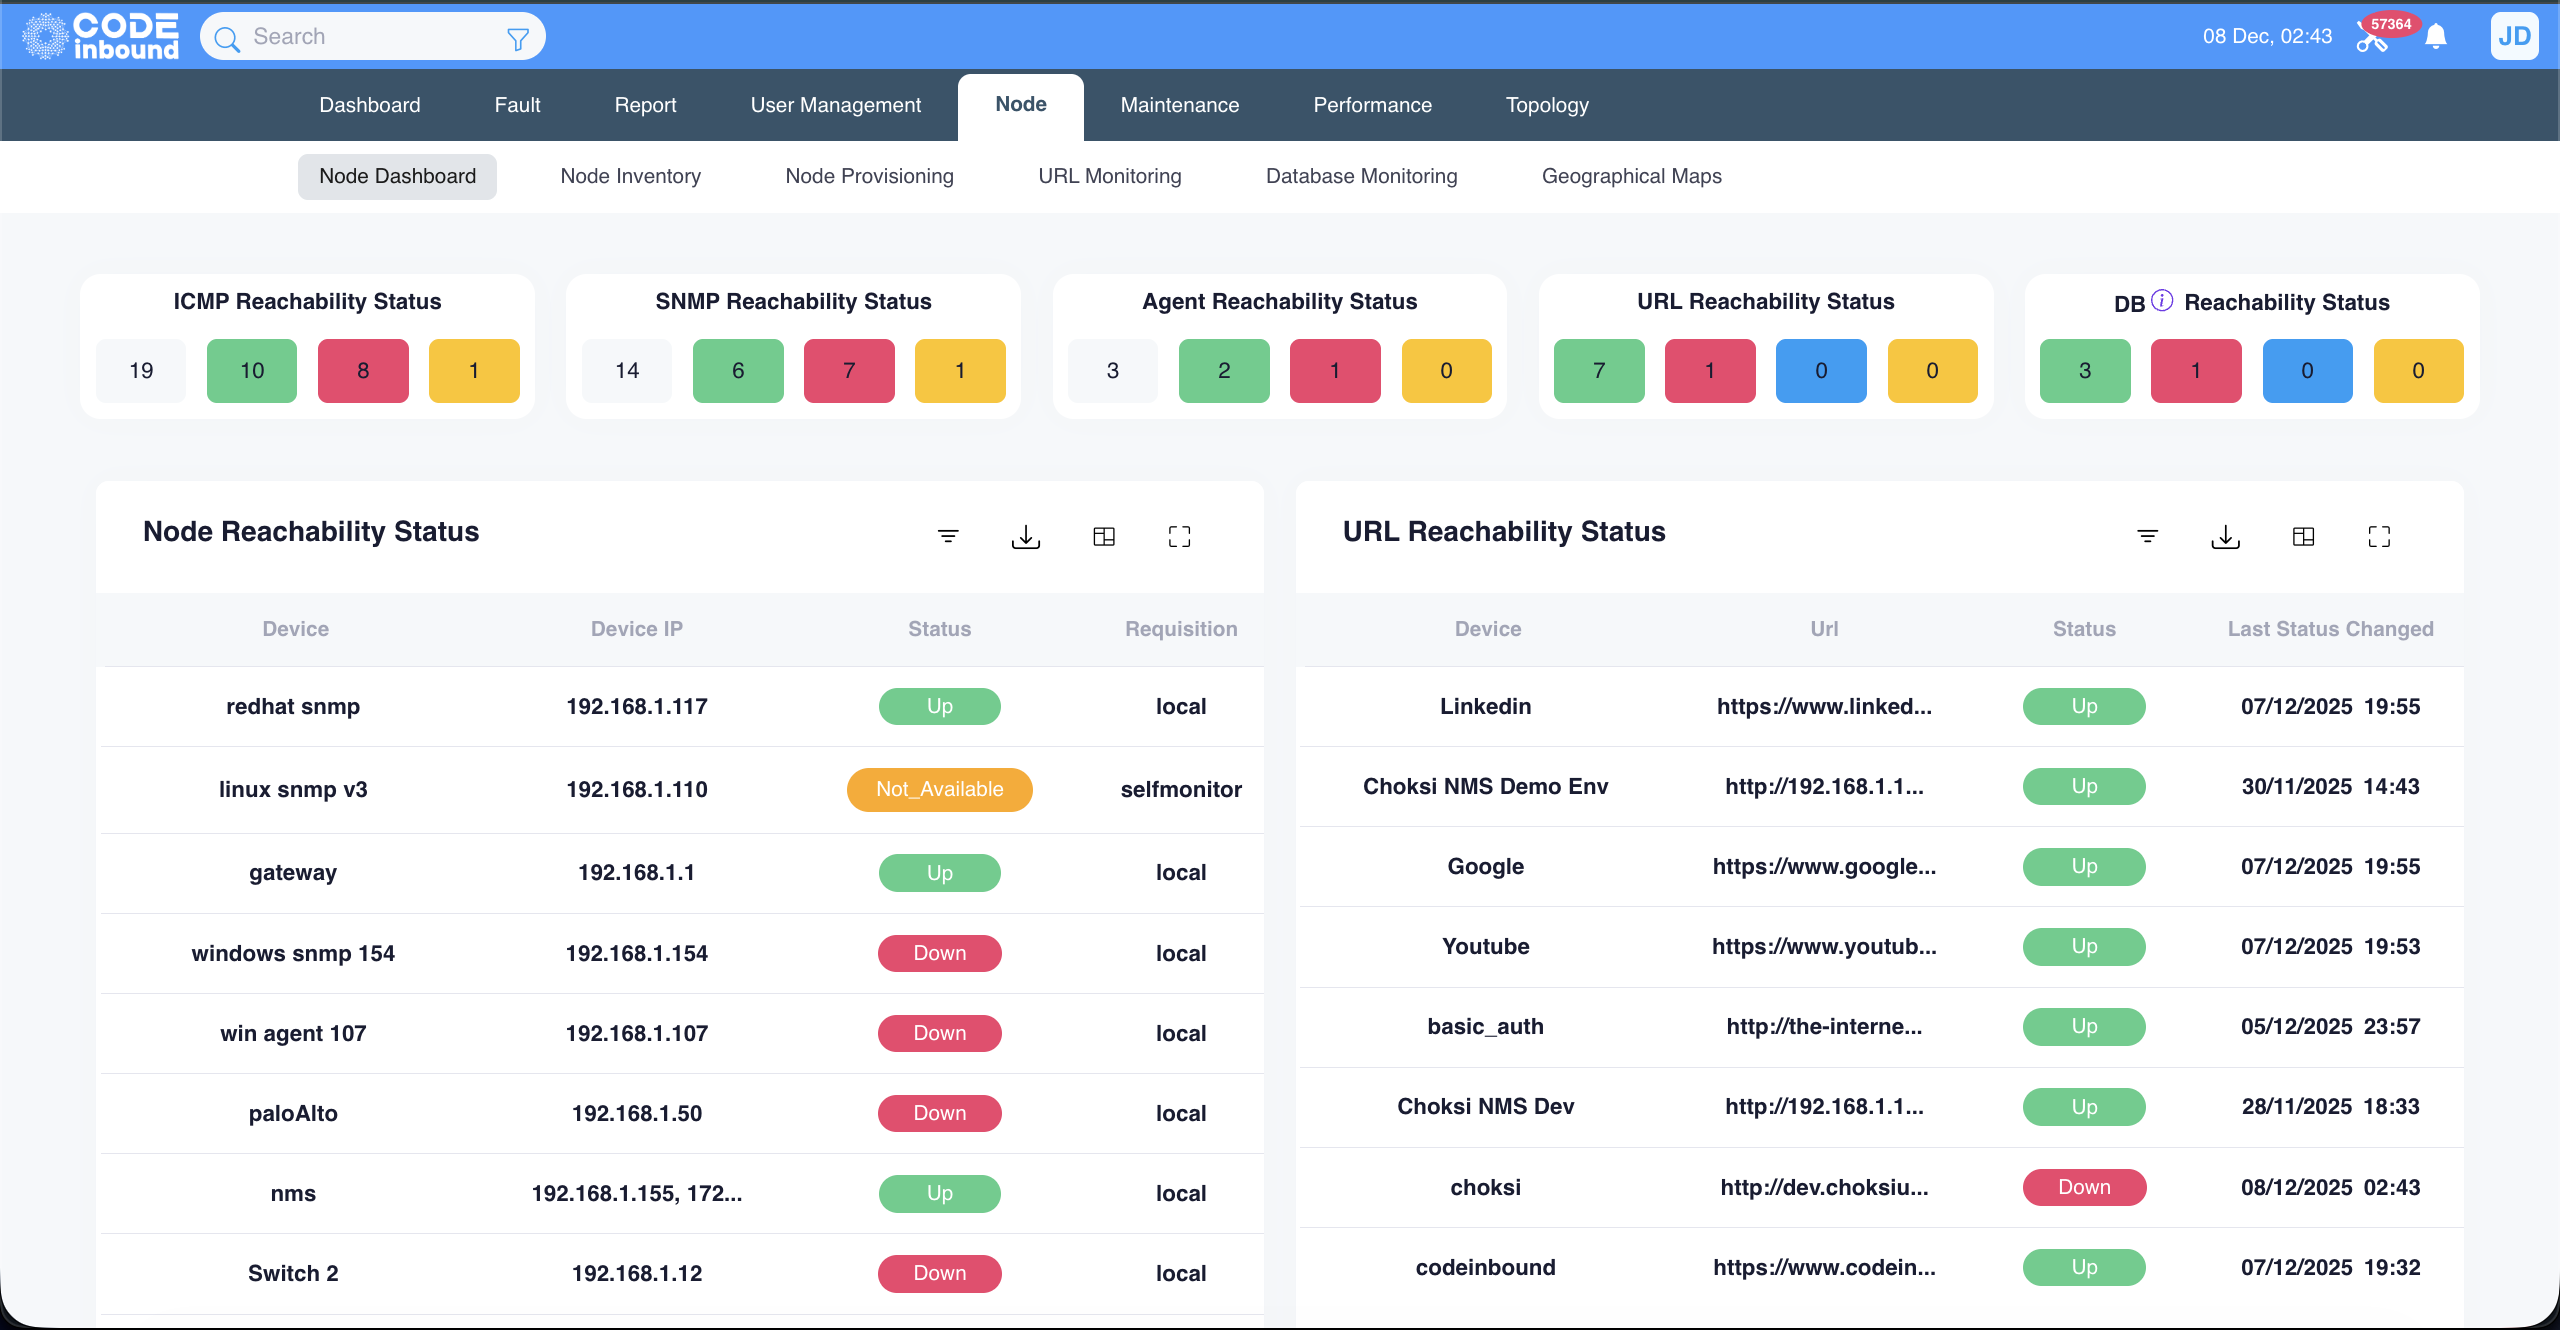
Monitor all aspects of your network nodes including interface status, bandwidth utilization, packet statistics, and real-time health indicators with instant alerting.
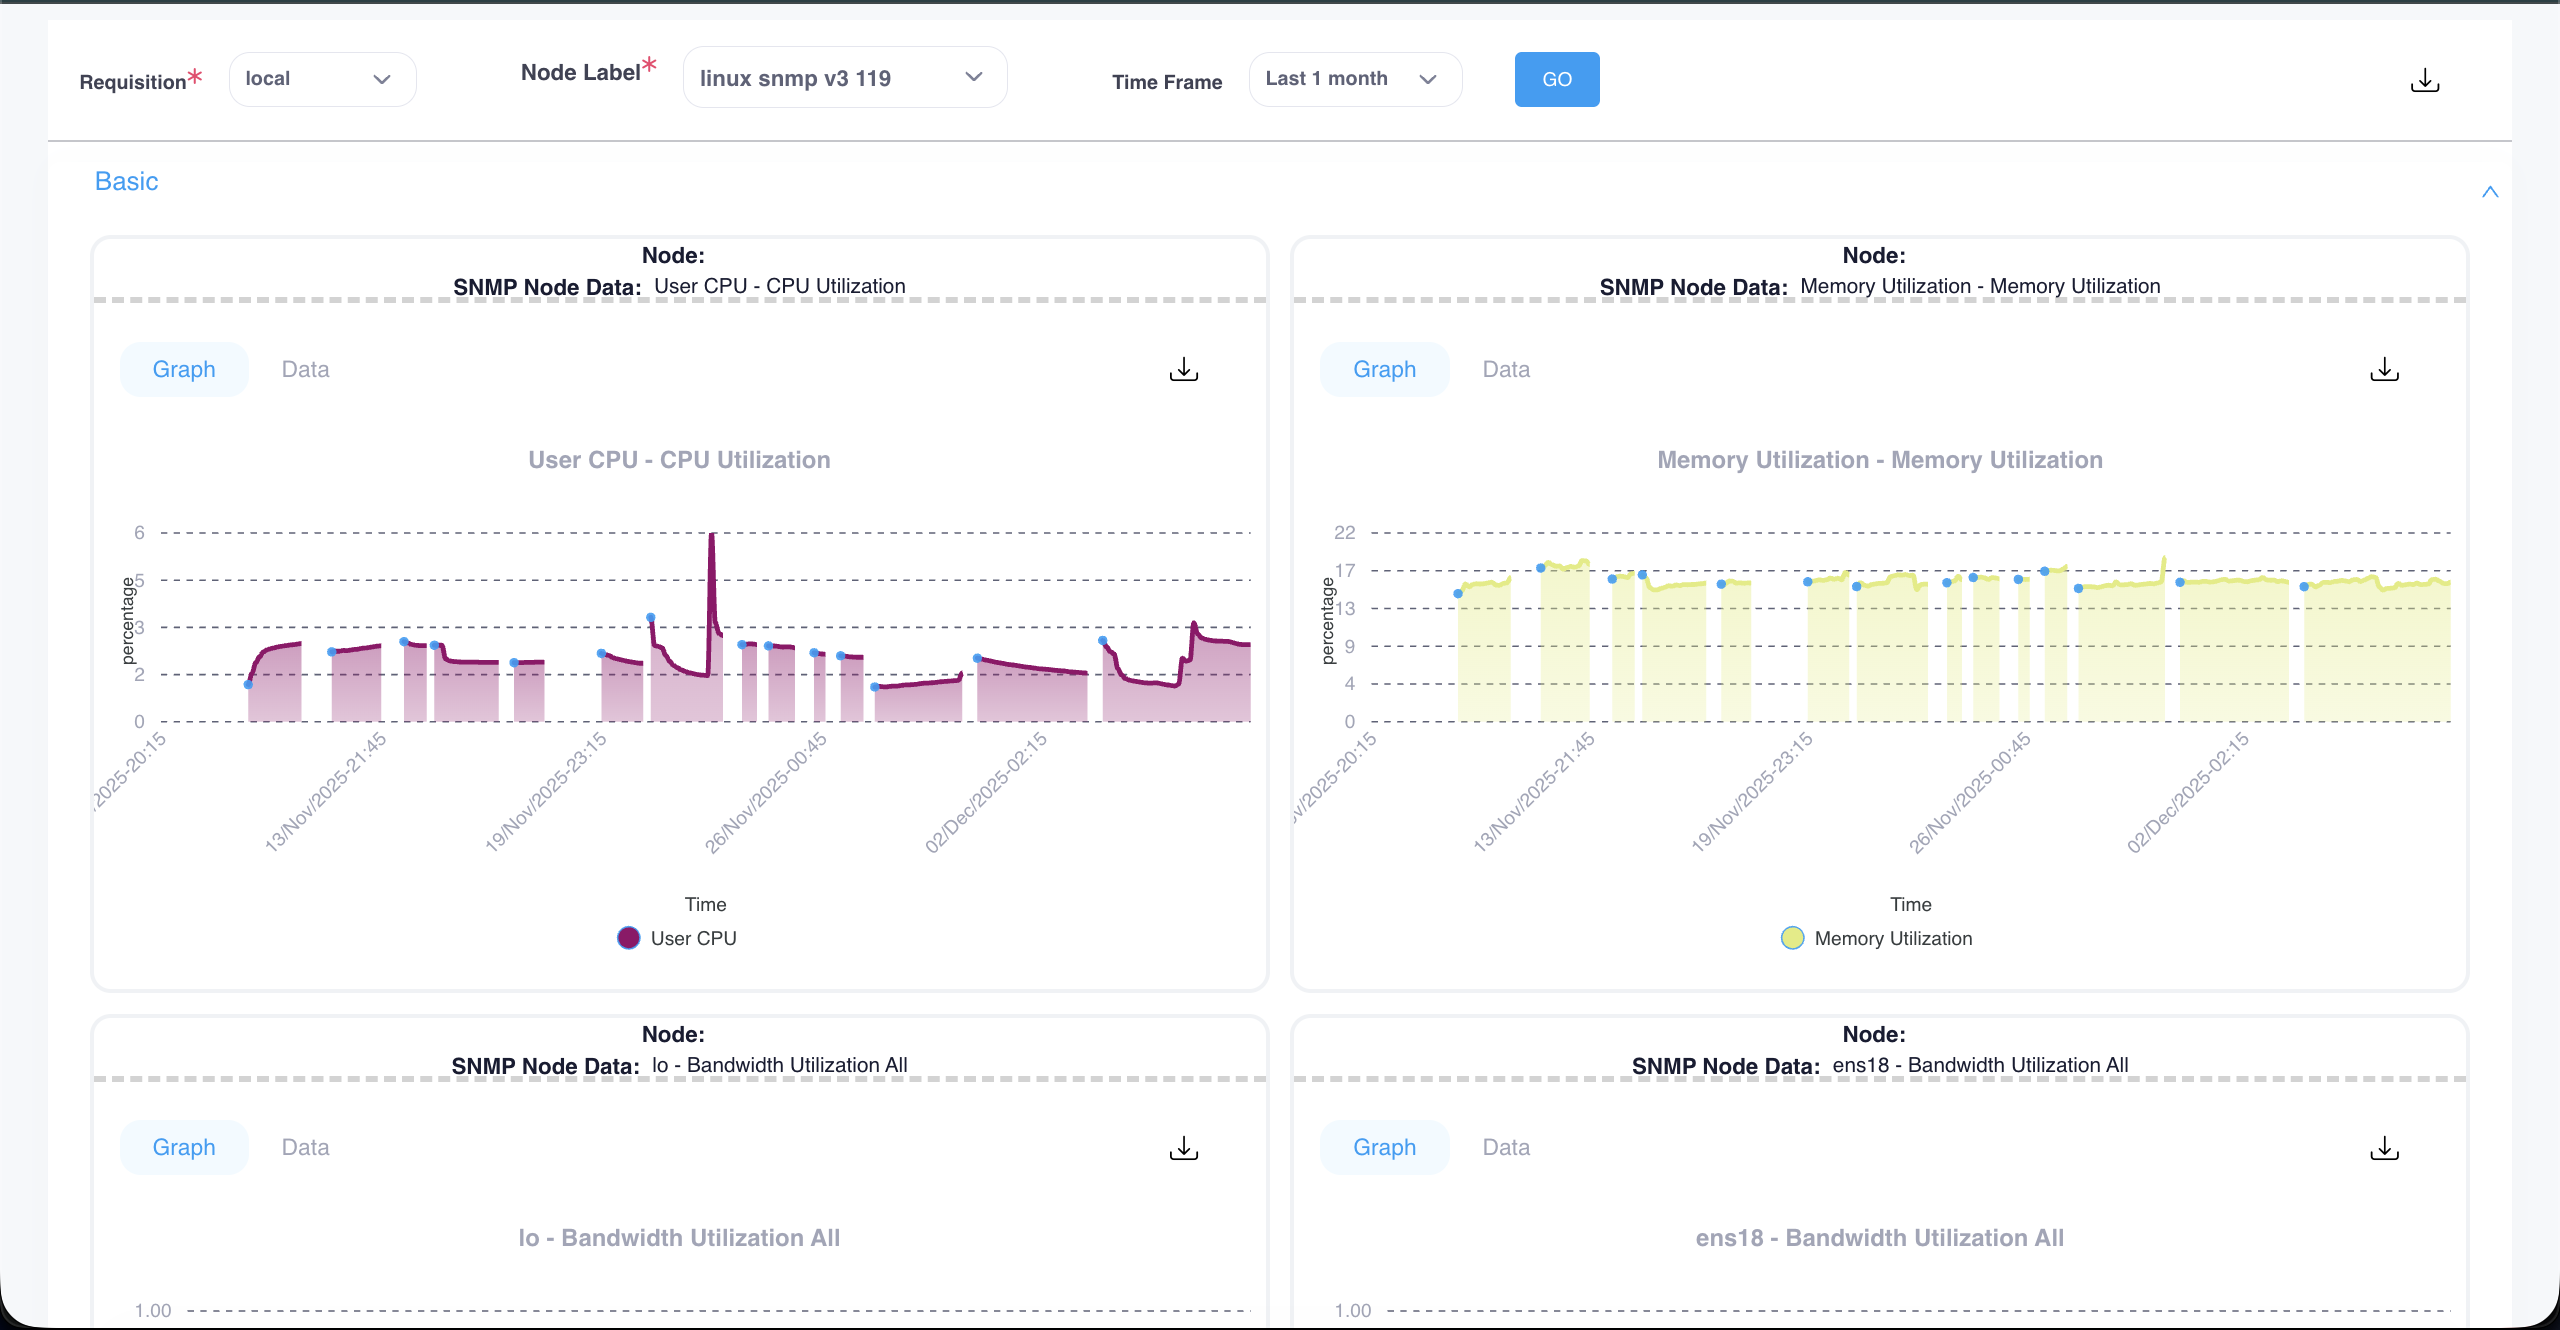
Historical trending with predictive analytics for capacity forecasting. Compare performance across similar devices with synthetic transaction monitoring.
Root cause analysis, event correlation, and maintenance window scheduling. Escalation policies ensure timely response to critical events with ITSM integration.
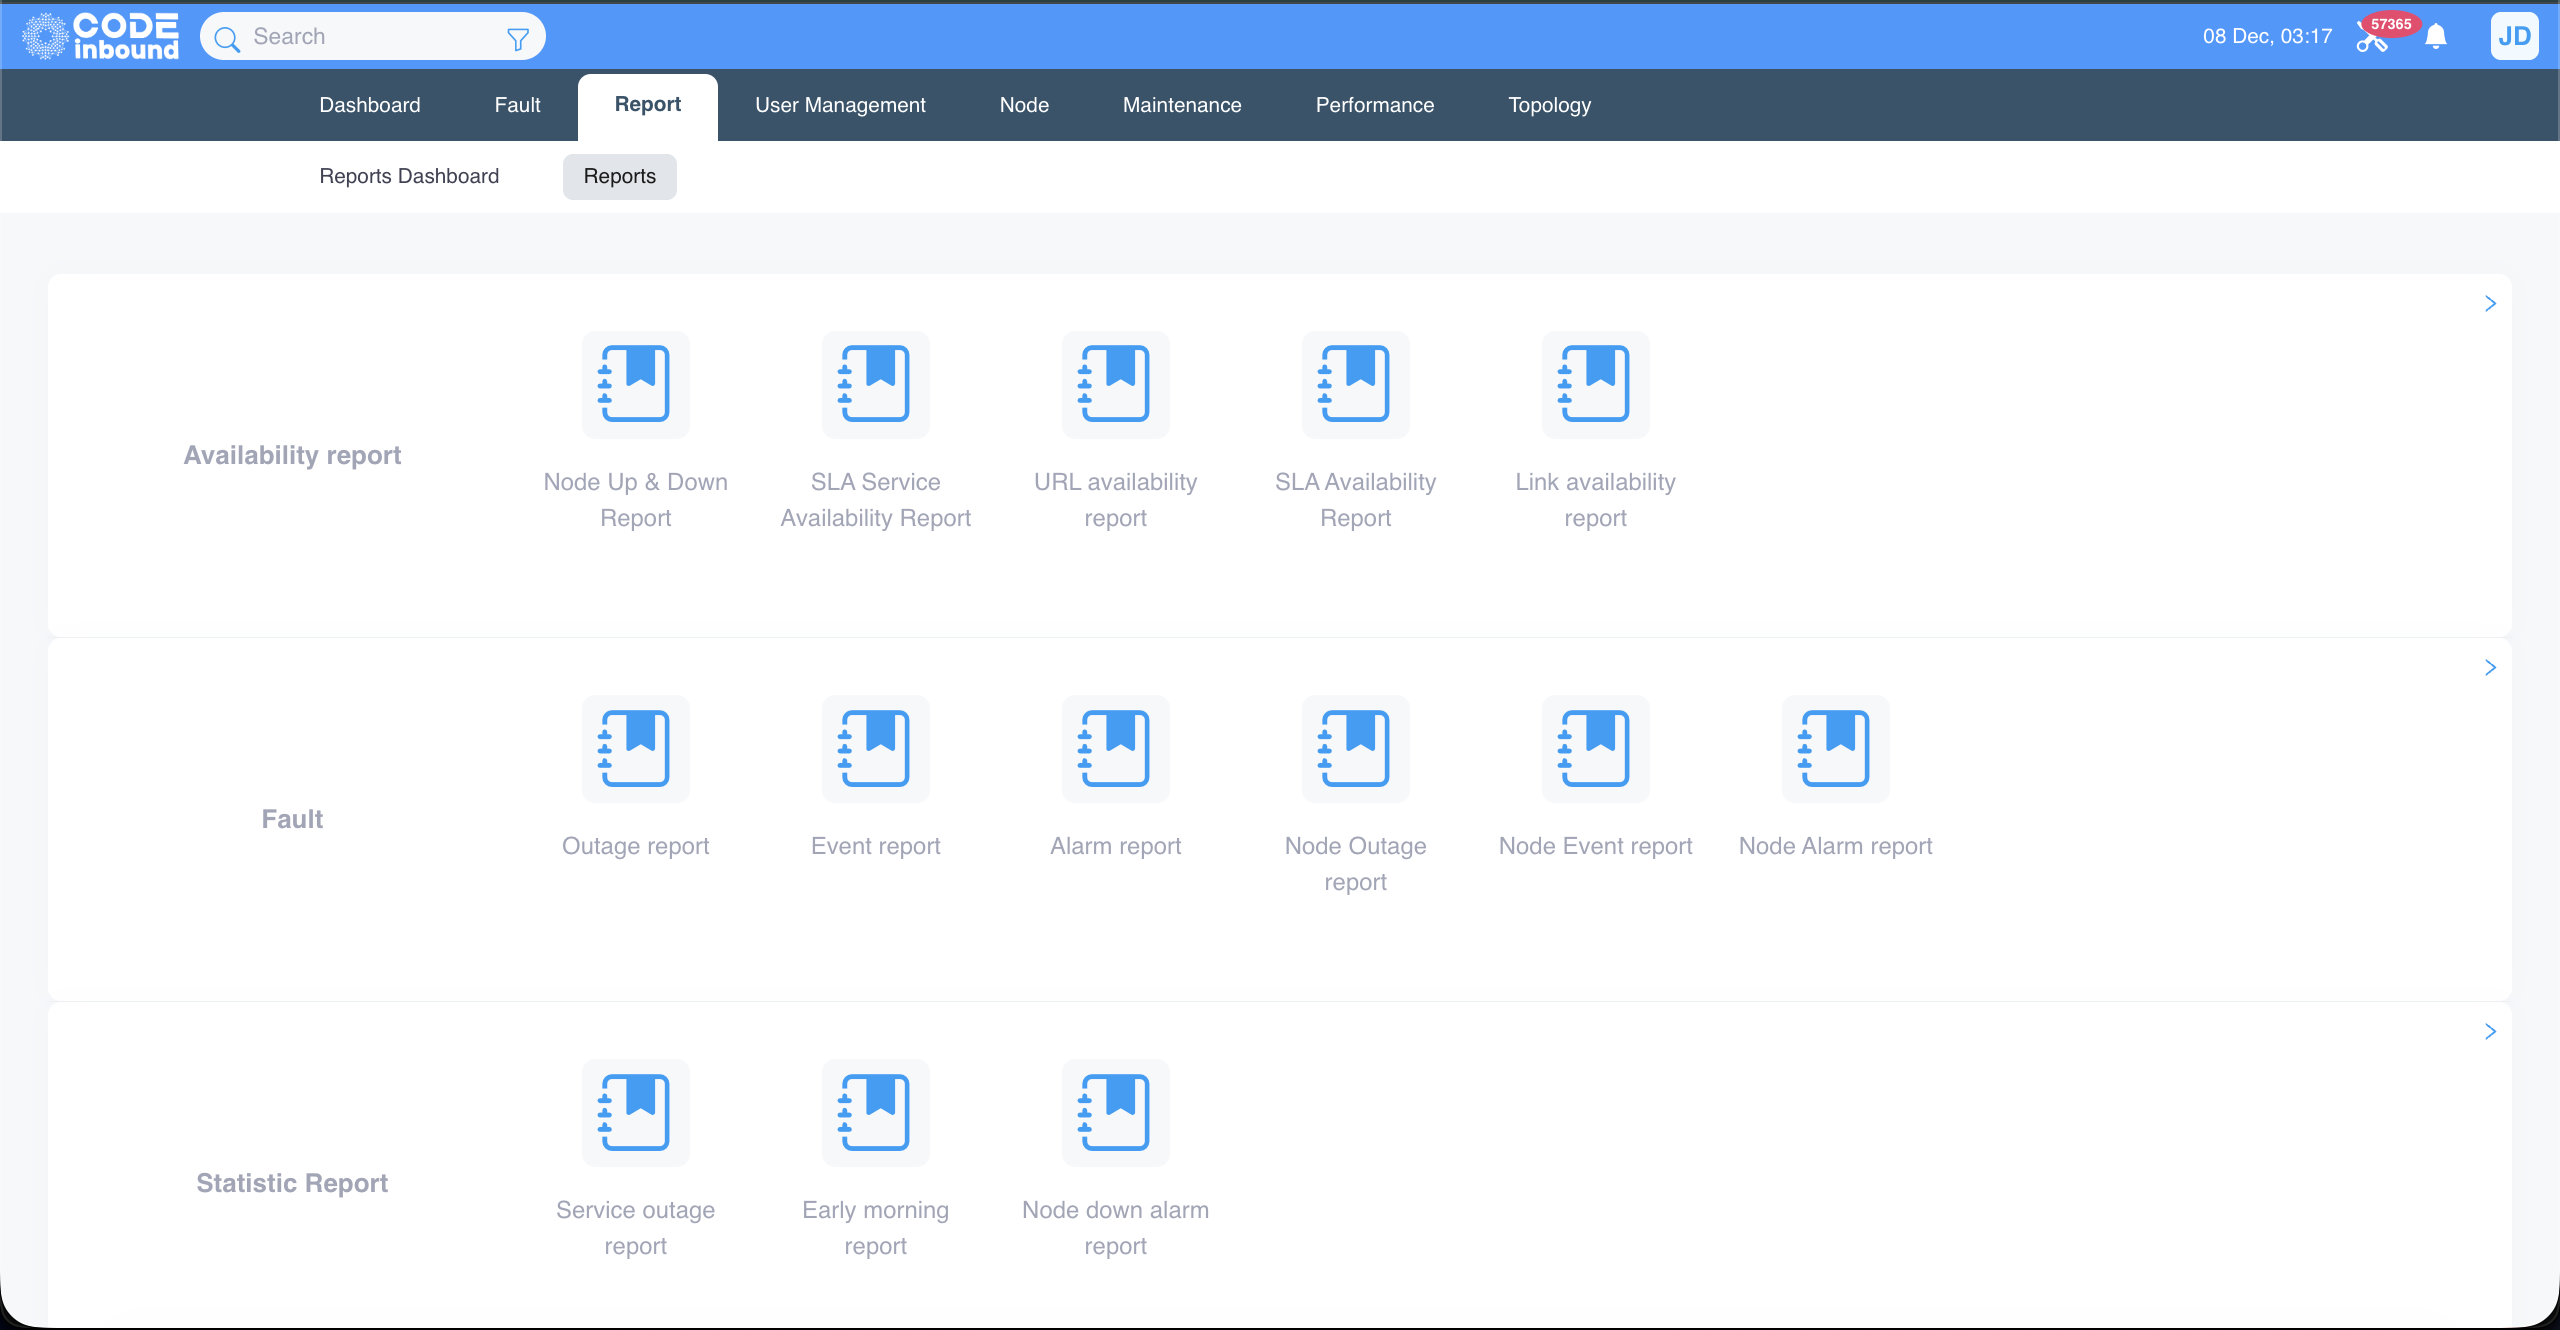
Transform monitoring data into actionable business intelligence with comprehensive reporting and integration capabilities.
Robust connectivity for data exchange with external systems. Bidirectional integration with ITSM, CMDB, and CRM tools.
SNMP v1/v2c/v3, IPv4/v6, SSH, Telnet, Syslog, sFlow, NetFlow, BGP, CDP, LLDP, and many more protocols supported.
Cisco, Juniper, Huawei, HP, ZTE, Checkpoint, Palo Alto, VMWare, Nutanix, and hundreds more vendors supported.
Reach out to us by filling out this demo form, and our team will get back to you with a personalized demonstration tailored to your infrastructure needs.